Presence is a tool that allows you to track the visitors of your places. Not only does it give you the names of your visitors and the dates of their visit, but it also presents you the data as sophisticated statistics in a variety of charts. The charts show
- the list of names of the visitors along with when they arrived and left, as well as the visit duration,
- the list of all unique visitors along with the number of total visits and the total duration of all visits,
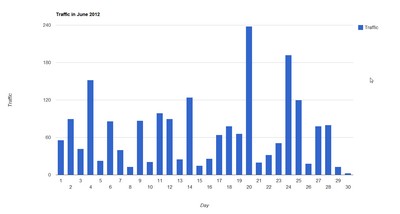
- the number of visitors per day of a particular month,
- the number of visitors per hour of a particular day,
- the average number of visitors per day of week (i.e. how many visitors there were on Sundays, for instance, throughout the entire time of operation of Presence),
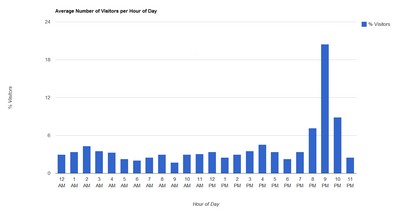
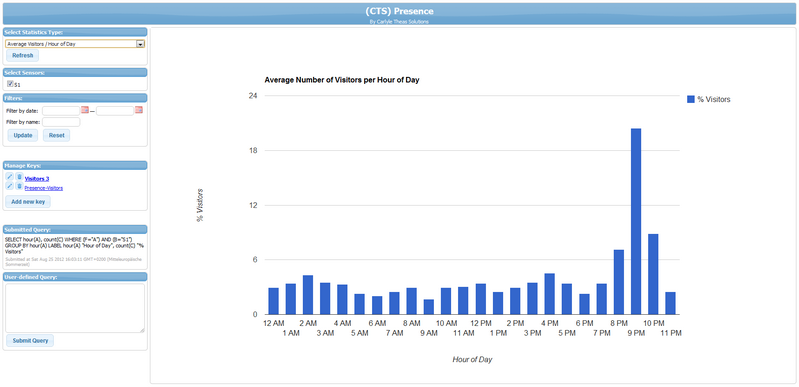
- the average number of visitors per hour of day,
- the number of simultaneous visitors,
- total times of you visitors per day/week/month
- traffic (avatar minutes during the last 24 hours),
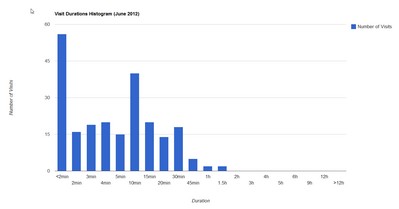
- histogram for how many visitors stayed for how long, and
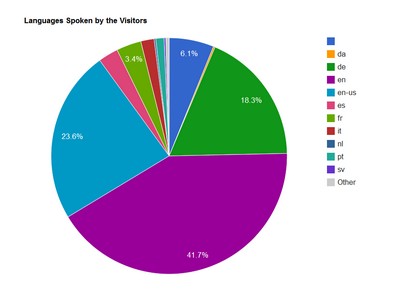
- the languages spoken by visitors.
Presence consists of a set of sensors you can set up at the locations you want to monitor. The sensors have copy permissions, so you can set up as many of them as you want. The Sensors can send messages to a list of people to notify them when someone arrives or leaves. Sensors come as one-prim spheres, but the scripts are copyable, so you can place it in any other object of your liking that will then act as a Presence sensor.
This data is presented on a web page, the Presence statistics page, as shown below.
Note: Presence 3 is based on Google Docs: all the visitor data will be logged to Google Docs spreadsheets. In order to use the device, a Google (Docs) account is required.
Example Charts
Below you can find some examples of the statistics Presence can create for you:

